


Weekly Plan 4/17/23; Feat. BlueMoonTrades
This weeks blog is inspired by a collaboration with BlueMoonTrades. We'll dive into a weekly recap, BMT will take over with MA's, and I'll talk about what I'm watching for next week!

Hello traders! :)
It’s fairly hard to do a recap of the week without repeating myself due to ES & SPY trading in a 10-11 day range. Below is a 2hr chart of ES after Wednesday’s plan was published. my overall pivot was $4140, I’d be looking for bullish action over $4140 and be bearish below. On Friday we saw a clean pullback into and bounce right off of $4140 which provided roughly 20pts!
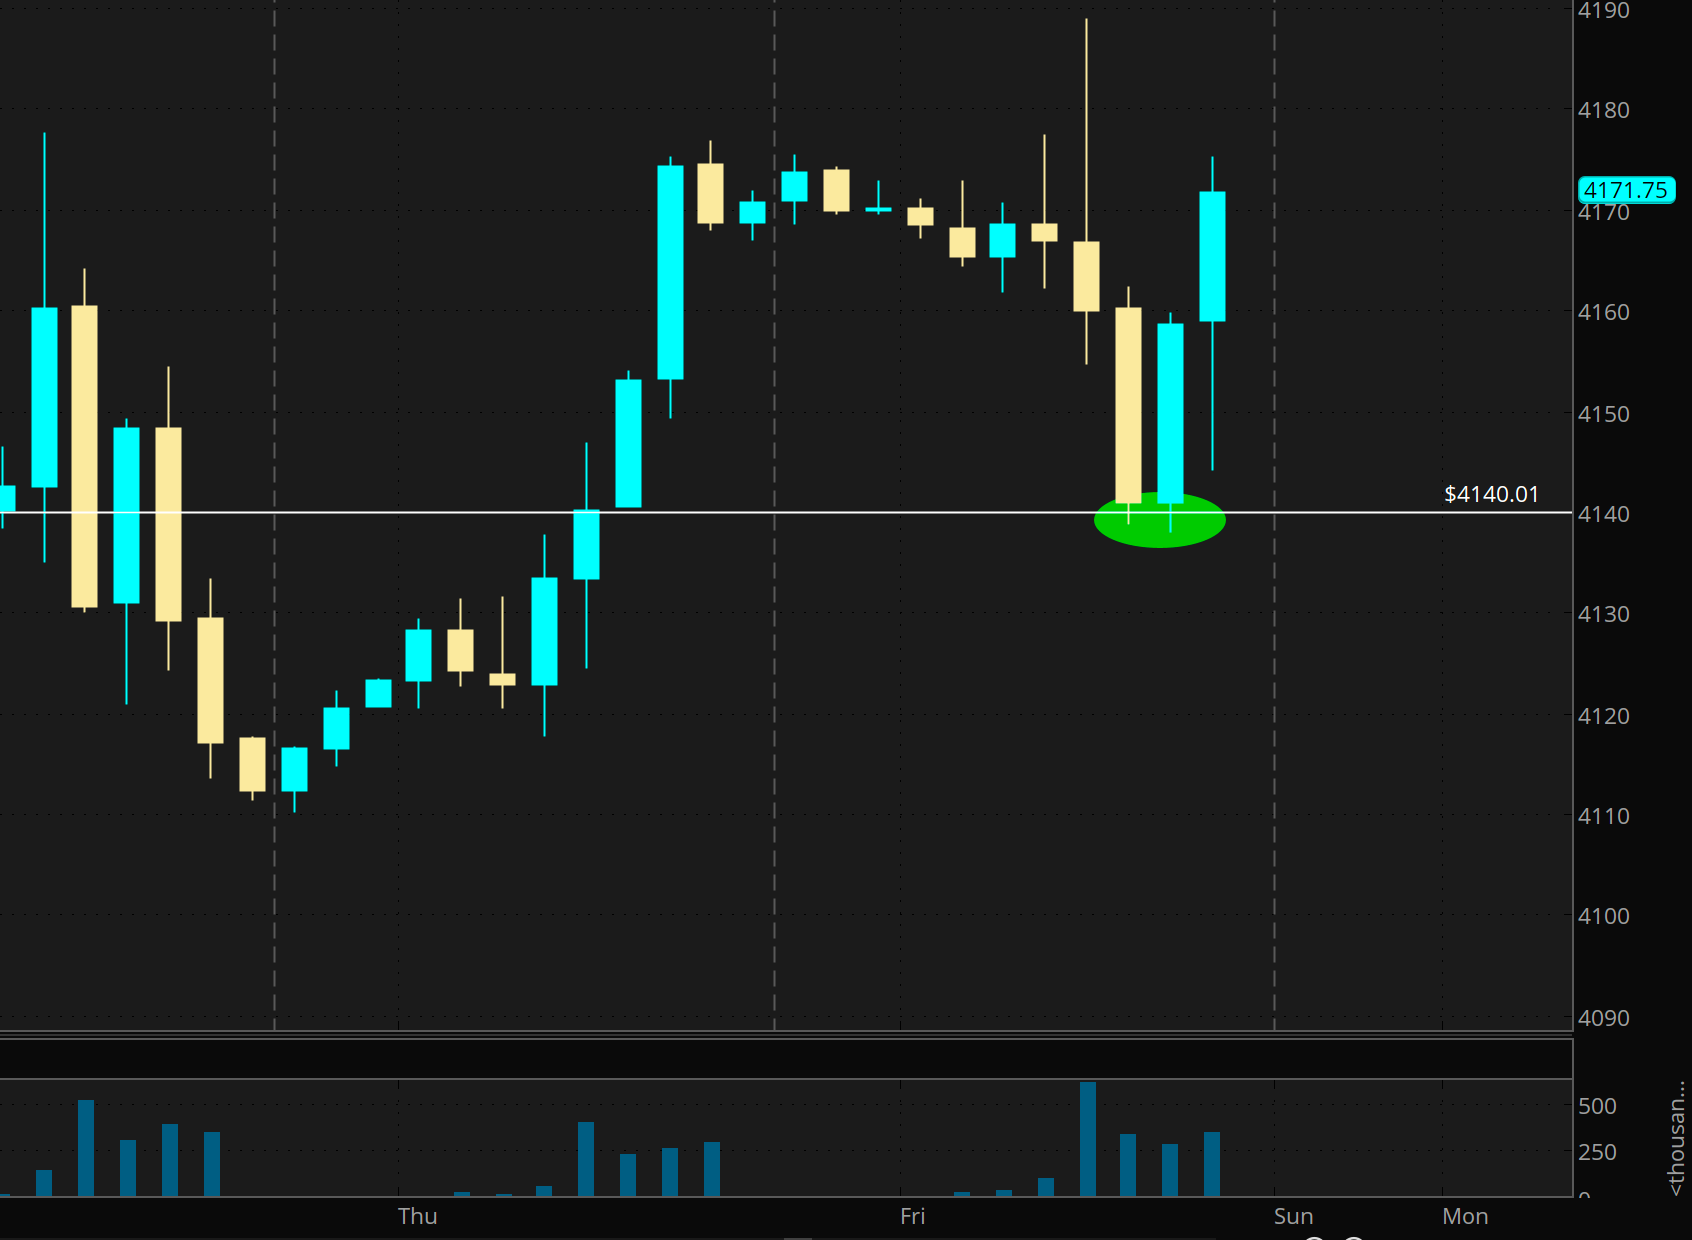
Sideways price action can be tough if you are always putting the pressure on for a range break. It’s important to take a step back, look at the bigger picture, and tell yourself to size down and trade for base hits until the range is broken.
*Please see previous newsletters and chat if you question the levels :) All of my levels regarding the S&P500 are from ES (S&P 500 Futures). Recaps are not to brag about right or wrong, primarily just to refresh previous thesis and direction*
Now, I am blessed to be able to introduce BlueMoonTrades (BMT)! He started trading options back in 2014 after a group of friends introduced him to technical analysis. Now, he provides a service to showcase his skills and help others out in the market.
BlueMoonTrades (BMT):
Today I am going to talk about some simple techniques on how I use moving average (MA) to my benefit while I trade
The first and foremost thing you need to know about Moving Averages is the difference between Simple Moving Average (SMA) vs. Exponential Moving Average (EMA)
“The primary difference between an EMA and an SMA is the sensitivity each one shows to changes in the data used in its calculation. SMA calculates the average of price data, while EMA gives more weight to current data. So, basically EMAs are more sensitive to the price action”
Me being a day trader or who likes to swing positions for a day or two, I like using EMAs (EMA clouds by Ripster to be specific) which are more sensitive to the current price
Some of my favorite EMA cloud settings are: 5,12 & 34,50 clouds and there is no specific reason on why these vs. something else. I just picked these up during my studies and back tests and started to trade on them
“The most important thing is to remember to enter and exit trades based on the cloud settings that you have chosen. If you enter a trade based on your setting and not want to use the same for your exit, the trade may fail most of the times”
Now enough of lecturing. Let’s get straight to a set up that I think may be worth considering for the coming week using the EMA clouds & Fib
Weekly breakout on the Fib at 0.786 level where price had max resistance. As of close on Friday, Apr 14th, price broke the resistance at that level and closed above. Also, 5,12 EMA cloud had a bullish cross over 34,50 EMA cloud

On daily, price broke & closed above the 1 Fib level on Thursday, Apr 13th and as of Friday, April 14th close, it retained the breakout. Also, price is very strongly holding the support on 5,12 EMA cloud

Now, with all these breakout opportunities on higher timeframe, all we want to do for day trading or may be swing for a couple of days is to go to a lower timeframe of like 15 mins for a day trade and 1 hour for a swing trade opportunity
For the sake of simplicity of this idea so that it’s actionable, let’s consider that you want to swing trade this opportunity
Looking at the 1 hour chart, I like the price breaking & closing above resistance at 0.618 level (At $412) as of Friday, April 14th close. I would go for At the money call options with 2-3 day expiry either on:
Test of support (Previous resistance) at around $412 OR
on the break and close above next level at $413.2
Stop on break and close below $411 if things don’t go your way
Remember, you are trading all this on 1 hour timeframe, so the breakouts , retests or stops are all on the close of candle on 1 hour timeframe
This is it guys. Hope you enjoyed reading this idea and hopefully you will be able to execute it as well on Monday
For more ideas everyday, follow me on my Twitter here.
I also have a discord service that provides:
Hand picked Options alerts during market hours with entries, exits and stop losses.
I post some trade ideas every night in discord for next day’s play.
Trading bots are set up that triggers entry and exit signals
News
Updates are provided everyday on what we have closed and what we are swinging to the following day
A full log of plays taken in a week with results are also published at the end of the week
Give it a try by using the promo code “KRSUBSTACK” for 25% off on the 20/mo plan. Brings the price down to $15/mo with the promo and the discount never expires!
Link: BlueMoonTrades Premium Room
Thank you all for reading !
*If you haven’t already, download the app and turn notifications on to access the Substack Chat. This is where I post intraday updates aside from the two newsletters a week. Please Like & Share to keep interactions up, this will help other traders find the newsletters! :)*
KR’s Thoughts:
With not a lot changing day to day with levels during this choppy market, I’ll briefly dive into my approach for the first half of the week for 4/17/23.
I was please on Friday with the support that was found at $4140. I’ll continue to keep that my overall bull/bear pivot. However, as long as we hold over $4167 I’ll be looking for stronger short term bullishness. If we break back below $4167, I’ll assume we will be going back into “chop state” and chop around. Upside targets remain the same; $4167 —> $4200 —> $4224. On the flip side, if we are unable to hold over $4140 and close below $4120-$4130 - I don’t think this will be good for the market. This may lead to an attempt for $4080 —> $4040. I have provided a chart below which outlines my plan :)

INTC is now looking interesting on Daily timeframe. It is presenting solid R/R if $30-$31.50 continues to hold as it is setting up for a Resistance/Support flip. I think $37 target is definitely in the cards here. (ER on 4/27)

AMD is now down almost 12% from when I turned bearish over $100.. Now sitting just over $90 I think it may find support off $90 and prepare for another rally towards $95-$100

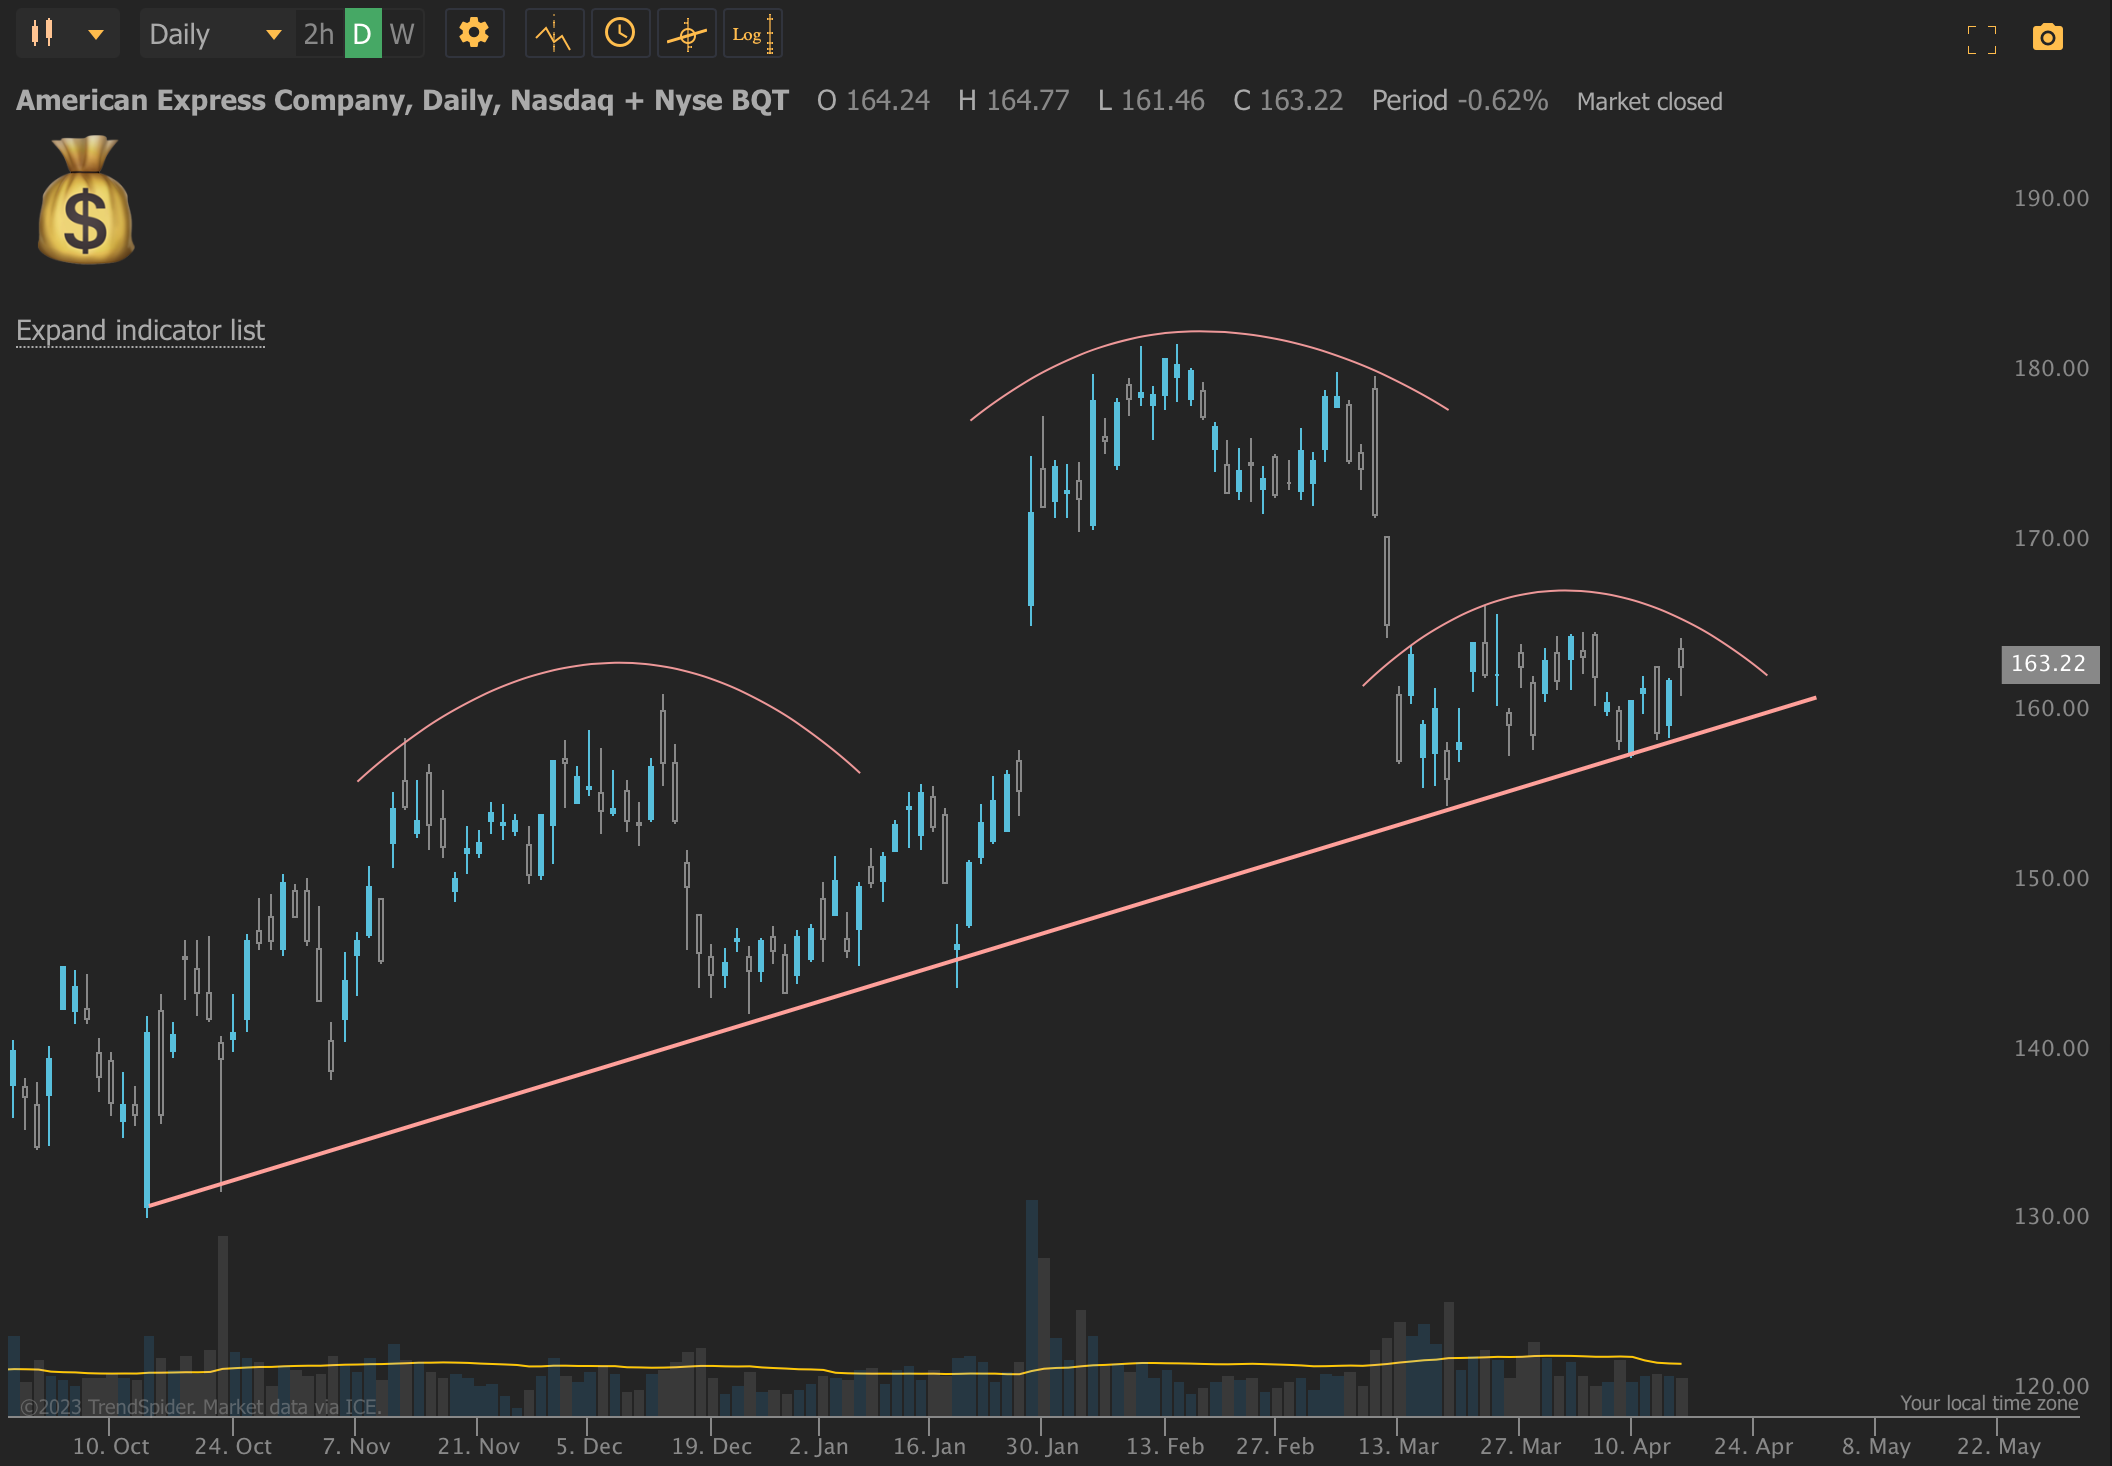
AXP has earnings on 4/20. Daily chart is setting up with a massive H&S.. If it is still unable to claim $165, it can setup for a big drop towards $155 —> $14
Bull ideas voided with ES below $4120 :)
— KR
All charts shared by me are from Trendspider use this link HERE if you’d like to look into their charting software! Occasionally I will share charts from Thinkorswim.
Disclaimer:
This is my personal analysis and is not to be taken as trading advice. I am not a professional nor am I licensed with anything associated with the Stockmarket. Trading involves risk and you will lose money. Everyone has a different risk tolerance, portfolio size, and style of trading. It is important to trade within your comfort.
Thanks KR. what is it that makes 4140 the pivot? i mean, it's clear from the charts that it's acting as a key level, but curious to know what was it that you saw ahead of it playing out in the charts.
thanks!