
Charting & Trading Guide P.8 → The Holy Grail Setup For Bull Markets 📈
Simple Trading = Portfolio Growth

Part 8 of a free, ongoing series breaking down key indicators, chart patterns, and trading strategies to help everyone better understand the market 🤝
When I first started trading, I didn’t need anything fancy. I just needed a way to find stocks that were already trending, stocks where momentum was on my side.
This strategy helped me do exactly that.
It’s simple. It’s repeatable.
And while it won’t win every time (nothing does), it’ll help you focus on setups that actually make sense in a bullish environment. It involves using indicators. Now, I rarely use indicators but his strategy helped me under the markets.
1️⃣ Start With Stocks Above Their 200SMA
The 200SMA is your long-term trend filter. If price is above it, the stock can be seen as in an uptrend → plain and simple.
Why it matters: You’re not trying to catch falling knives. You’re looking for names already showing strength. Strong stocks tend to stay strong, especially in a bull market.
2️⃣ RSI Above 50 = Momentum on Your Side
RSI (Relative Strength Index) above 50 tells you buyers are stepping in.
Why it matters: You’re aligning with momentum, not guessing. A stock reclaiming RSI > 50 after a pullback often means the next push could be starting.
3️⃣ Bullish MACD Cross = Confirmation
When the MACD line crosses above the signal line, it’s a visual sign that momentum is shifting back up.
Why it matters: On its own, MACD isn’t perfect… but paired with RSI > 50, it gives more confidence that the trend is turning in your favor.
Now you’ve got your watchlist → stocks above the 200SMA, RSI > 50, and a bullish MACD cross.
The final step?
4️⃣ Find the Downtrend Line ✏️
Look for a downtrend line or a stock that could be ready for a breakout. A series of lower highs that’s been containing price and structure. Draw it using wicks or candle bodies (consistency is key). See example below
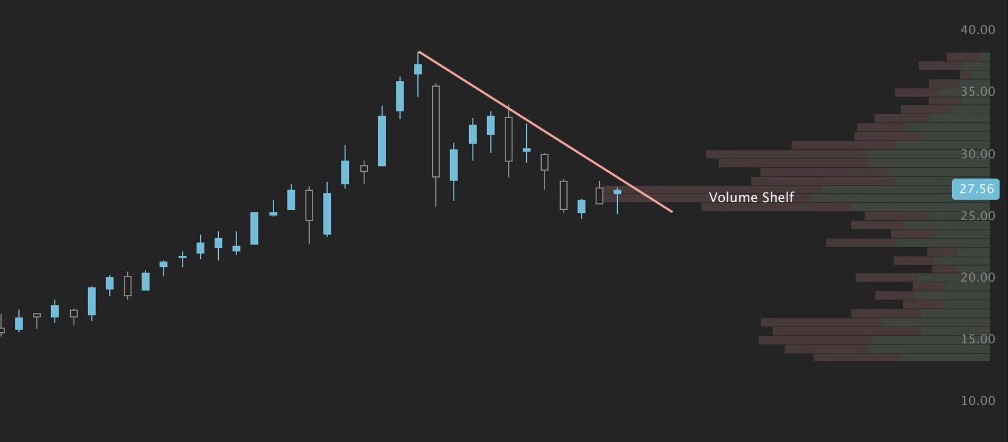
Once price starts pressing against that line, you’re watching for the breakout. That’s often where momentum shifts from consolidation → continuation.
Notice in the example above how price is coiling just under a trendline, right near a volume shelf. This is where I start paying attention.
5️⃣ The Breakout = The Trigger 🚀
When the downtrend line finally breaks with solid volume, that’s your entry signal.
Entry: on the breakout or a clean retest
Stop: just below recent support
Target: prior swing high or next volume gap
You’re not chasing. You’re reacting to confirmation.
Bear Markets? Flip It 🔄
The same logic applies, just inverse it.
Look for stocks below their 200SMA, RSI below 50, and a bearish MACD cross. Instead of breakout plays, you’re watching for breakdowns.
Something to remember 👇
This is the strategy I used early on because it helped me find stocks within the trend, not fighting it.
But let’s be real…
Not every stock that fits these criteria will run.
Sometimes it’ll fake out and fail.
Sometimes the best setups just need more time.
And that’s okay. Trading isn’t about being right every time → it’s about having a process that stacks probabilities in your favor.
Reminder, this is not financial advice. I am merely talking about a simple strategy that I have used. You should backtest this on your own and make sure this is something that fits within your personality and trading goals.
- KR
Reminder: This is not financial advice. These are my trade ideas and you should do your own research before taking any trades. I provide the daily trade ideas I am watching. It is up to you to read them and form your plan on how you want to trade them.Disclaimer:
This is my personal analysis and is not to be taken as trading advice. I am not a professional nor am I licensed with anything associated with the Stockmarket. Trading involves risk and you WILL LOSE MONEY. Everyone has a different risk tolerance, portfolio size, and style of trading. It is important to trade within your comfort.