
Technical Analysis Guide P.6 → Trading With EMAs📈
Simple Guide Can Help Hold Winners

Part 6 of a free, ongoing series breaking down key indicators, chart patterns, and trading strategies to help everyone better understand the market 🤝
Real quick… We’re on streak right now! Six sinning alerts in a row😮💨
Trading with Exponential Moving Averages (EMAs) is one of the simplest yet most powerful trend-following tools in technical analysis. EMAs help traders identify the direction and strength of a trend, spot dynamic support/resistance levels, and generate high-probability entry and exit signals by giving more weight to recent price action than older data.
History and Origin
The concept of moving averages dates back to 1833 when the Bank of England used them to smooth financial data. The Exponential Moving Average (EMA) was pioneered in the early 1960s by P.N. (Pete) Haurlan, a rocket scientist at NASA’s Jet Propulsion Laboratory, who applied exponential smoothing to stock prices (calling them “Trend Values”). It was later popularized in modern trading through books like Technical Analysis of Stock Trends and by traders such as Linda Raschke (famous for her 20 EMA “Holy Grail” pullback strategy). EMAs exploded in popularity with the rise of computerized charting platforms in the 1980s–1990s because they respond faster to price changes than Simple Moving Averages (SMAs).
Here’s how they are calculated 👇
EMA = (Current Price × Multiplier) + (Previous EMA × (1 − Multiplier))
Multiplier = 2 / (Period + 1)This makes EMAs more sensitive and “faster” than SMAs, reducing lag in trending markets while still smoothing noise. Thankfully, all our charting softwares do the math for us!
Most Common EMAs and Why Traders Use Them
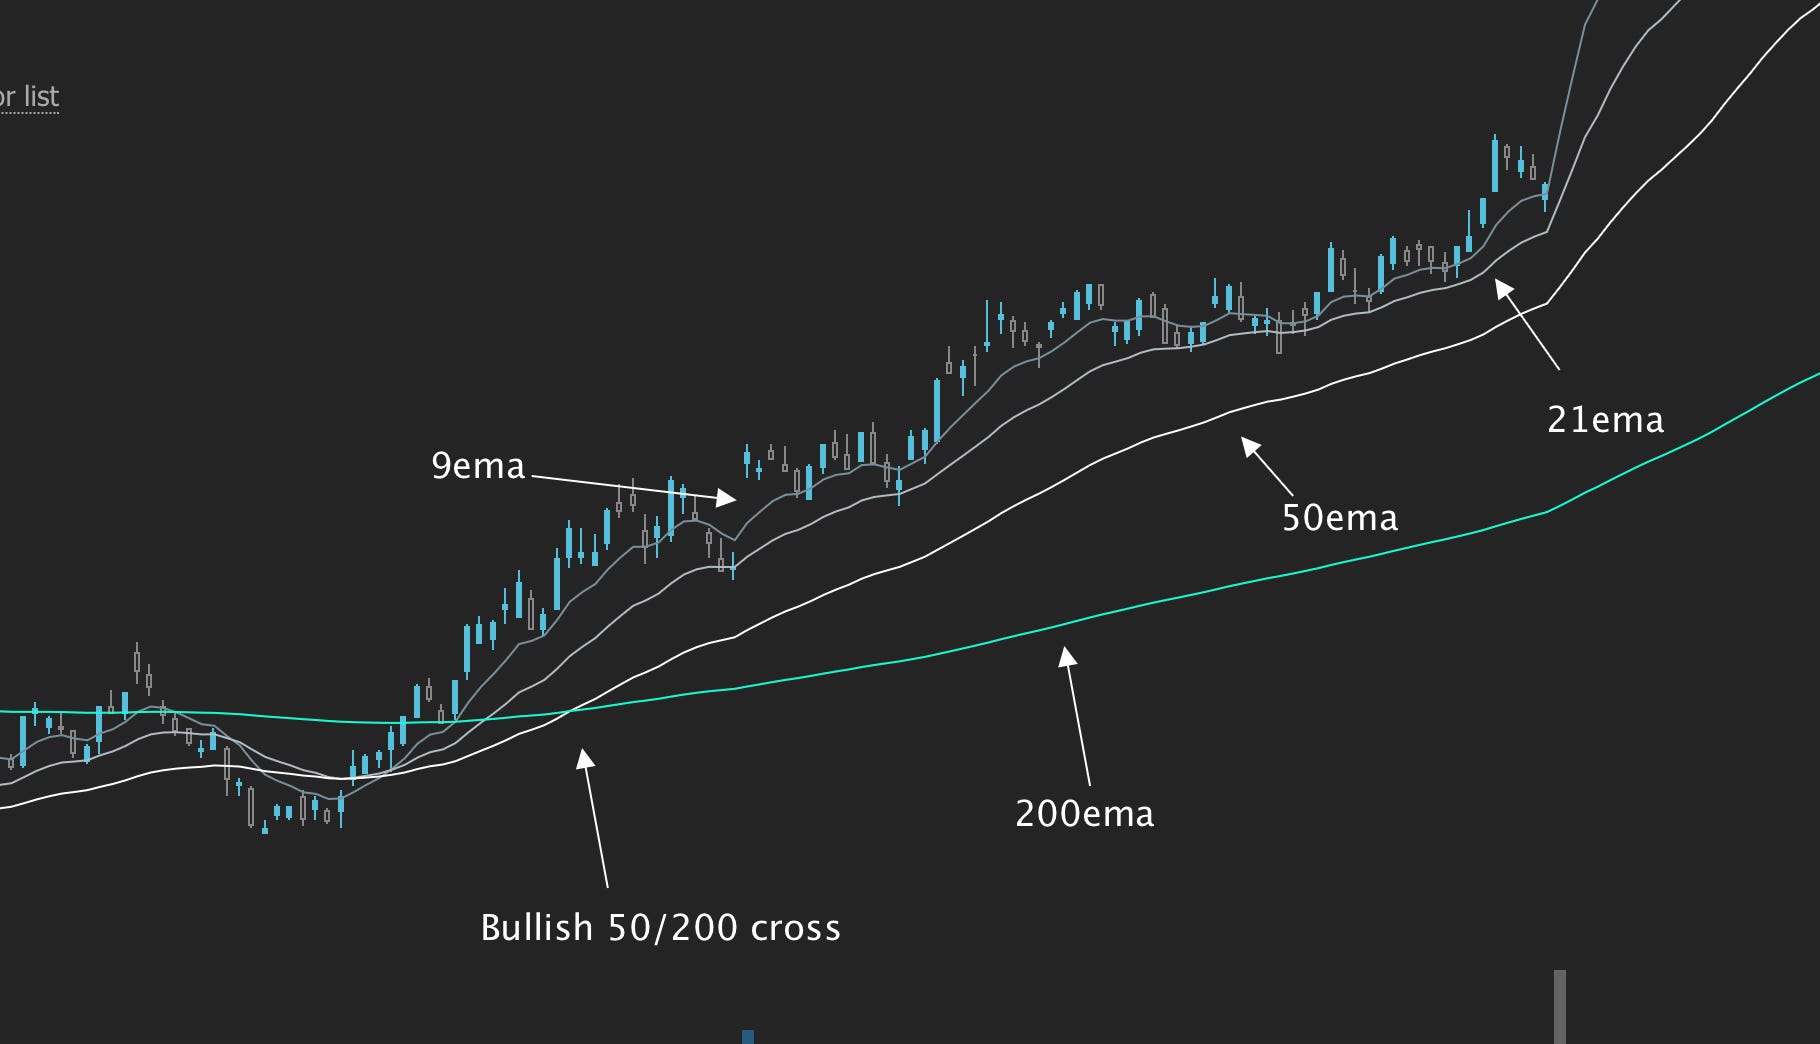
9 EMA → Ultra-short-term momentum. Ideal for day trading and scalping. It hugs price closely and is often the first to signal shifts
21 EMA → Intermediate momentum. Paired with the 9 EMA for clean crossover signals. Many intraday traders swear by the 9/21 combo because it balances speed and reliability
50 EMA → Medium-term trend filter. Acts as dynamic support/resistance in swing trading. The 50/200 “golden cross” or “death cross” is a classic longer-term signal
200 EMA → Long-term trend anchor. Widely used by institutions and swing/position traders to define the overall market bias (price above 200 EMA = bullish & below = bearish)
Why these specific numbers? They align well with natural market cycles (9 ≈ 2 weeks of trading days, 21 ≈ 1 month, 50 ≈ quarterly, 200 ≈ yearly) and have stood the test of time across stocks, forex, crypto, and futures.
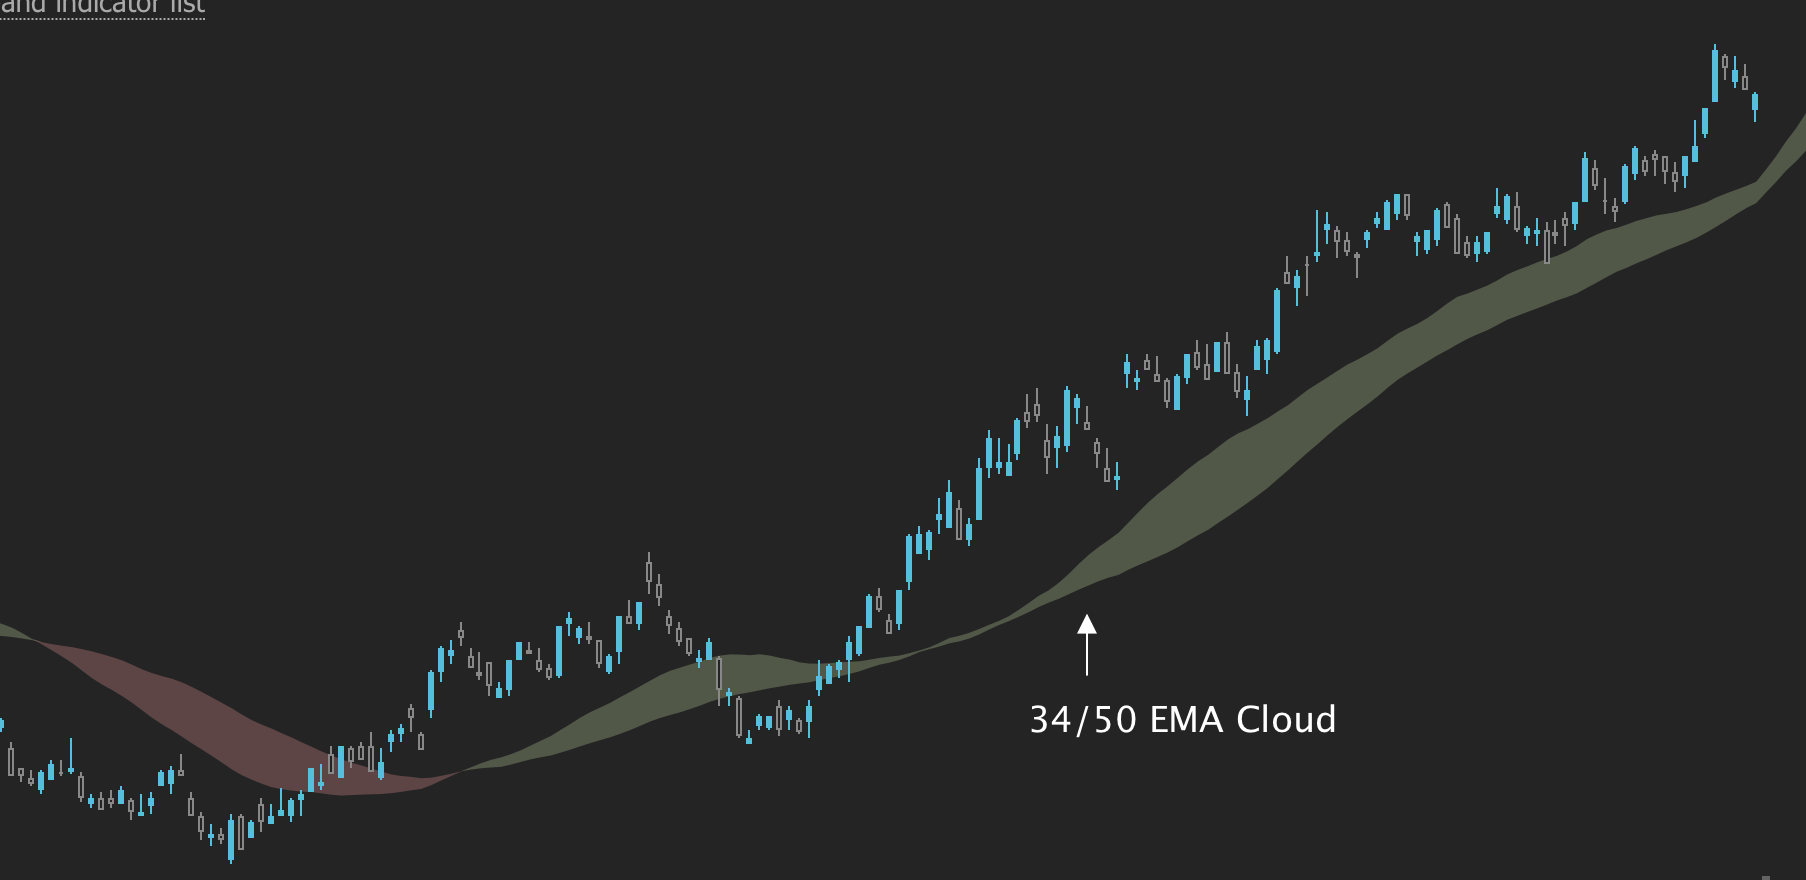
EMA Clouds: An EMA Cloud (sometimes called Ripster EMA Clouds or Triple EMA Cloud) is created by plotting two or more EMAs and filling the area between them. Popular versions include:
8/13/21 EMA cloud
34/50 EMA cloud
It’s simply an easier way to visually read the EMA and stock trends.
Price above the cloud → Strong bullish bias (green cloud in many platforms)
Price below the cloud → Strong bearish bias (red cloud)
Price inside the cloud → Choppy/consolidation (avoid trading)
Traders love EMA clouds because they provide an instant visual “zone” for pullback entries and help filter out noise. Bounces off the cloud often produce high-probability continuation trades.
When EMA Strategies Work Best
Strong trending markets (uptrends or downtrends)
Higher timeframes (4H, daily, weekly) for swing trading
When combined with volume, levels/patterns, and other indicators
Pullback-to-EMA setups in the direction of the dominant trend
Does NOT work best:
Ranging or choppy sideways markets → frequent whipsaw crossovers and false signals
Very short timeframes (1–5 min) without strict filters
Low-volume or news-driven spikes
As a standalone tool in strong counter-trend moves
Performance Statistics
Standalone EMA crossovers are mediocre (typical win rate 40–55%), but filtered EMA strategies shine:
9/21 EMA pullback strategy in trending markets: 60–75% win rate in backtests (with proper risk-reward)
Price-above-200-EMA trend-following: often 55–65% win rate with large average winners
EMA cloud bounce setups: traders report 65–80%+ win rates when price respects the cloud in strong trends
Overall: Even at ~50% win rate, EMA strategies are profitable because winners are typically 2-3x larger than losers in trending conditions
How To Trade With EMAs:
1. Classic EMA Crossover (Momentum Entry)
Long entry: 9 EMA crosses above 21 EMA + price above 200 EMA
Short entry: 9 EMA crosses below 21 EMA + price below 200 EMA
Stop Loss: Below the most recent swing low (or just under the slower EMA)
Take Profit: Next major resistance or 1:2+ risk-reward; trail using the 21 EMA
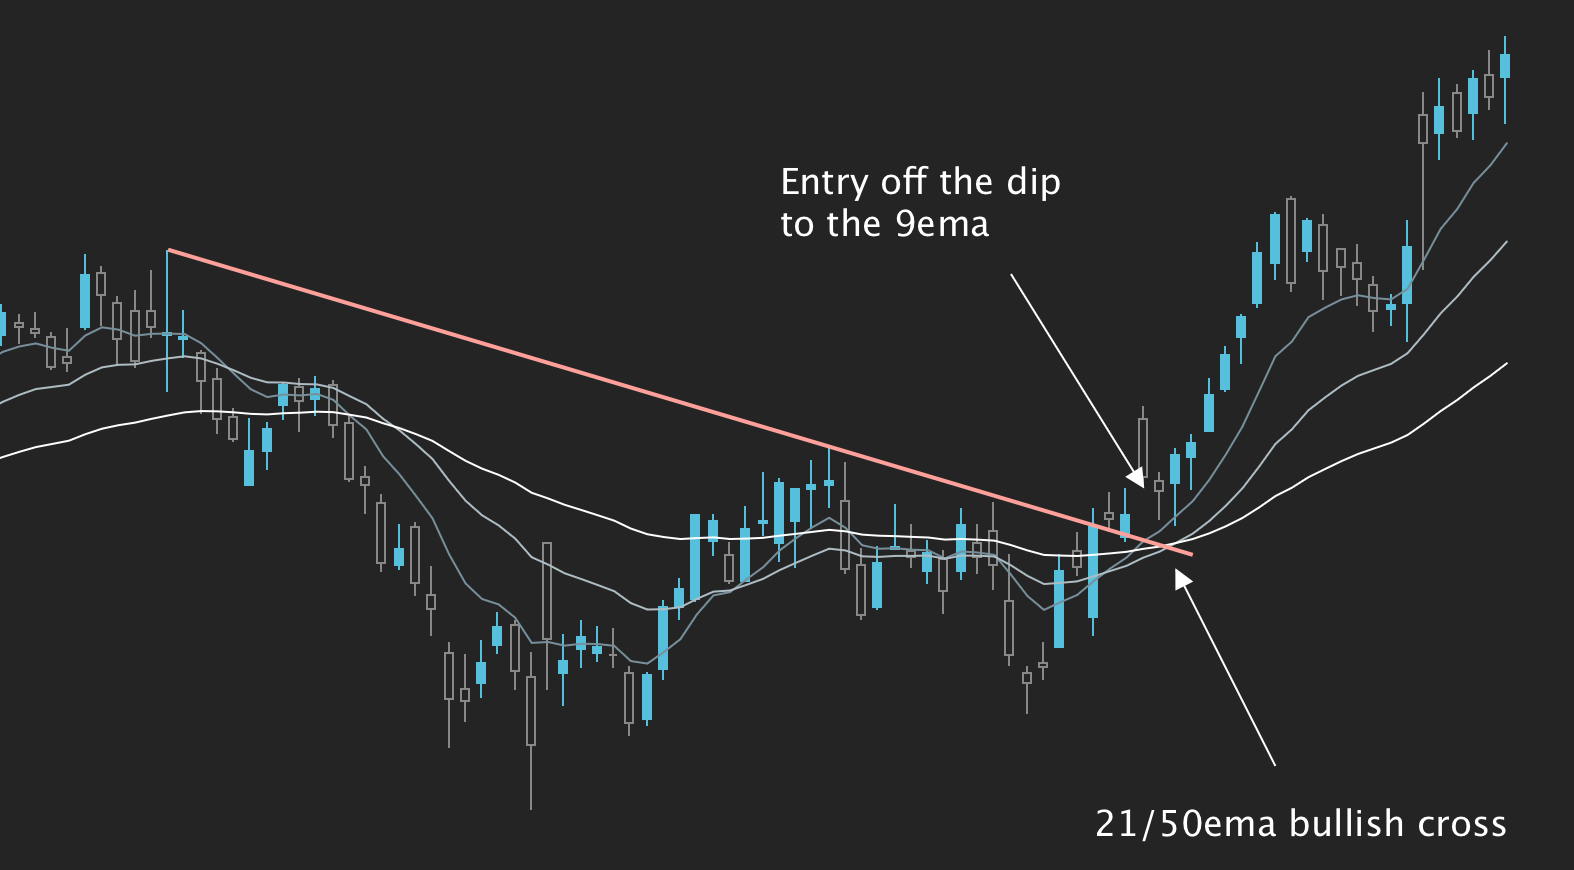
2. Pullback-to-EMA (Higher Probability)
In an uptrend (price above 200 EMA): Buy when price pulls back and bounces off the 9 or 21 EMA
Stop below the EMA or recent low
3. EMA Cloud Strategy
Long: Price pulls back into the cloud and bounces off the lower edge (with bullish candle confirmation)
Short: Price rejects the upper edge of the cloud in a downtrend.
Stops set just outside the opposite side of the cloud
EMAs are not magic, they are lagging indicator. When used with trend context, volume, and strict risk management, they remain one of the most reliable tools for both beginners and professionals. The 9/21/50/200 combo plus EMA clouds gives you everything you need for trend identification, dynamic support/resistance, and high-probability setups across any market or timeframe.
- KR
Reminder: This is not financial advice. These are my trade ideas and you should do your own research before taking any trades. I provide the daily trade ideas I am watching. It is up to you to read them and form your plan on how you want to trade them.Disclaimer:
This is my personal analysis and is not to be taken as trading advice. I am not a professional nor am I licensed with anything associated with the Stockmarket. Trading involves risk and you WILL LOSE MONEY. Everyone has a different risk tolerance, portfolio size, and style of trading. It is important to trade within your comfort.