


Mastering Trading W/ AVWAP + Trade Ideas
Want something to add to your trading arsenal?

Before we introduce a trading strategy using AVWAP, I’d like to point out the strong finish we had on Friday to cap the week off!

In the pic above you can see over 200pts called out in one day! That’s nearly $4k per one contract of ES…
AVWAP:
In the ever-evolving world of financial markets, traders constantly seek tools and strategies to gain an edge. AVWAP is a powerful indicator that combines volume and price data to provide valuable insights into market trends and potential trading opportunities. This is something I use to gauge intraday trends. I don’t solely trade off AVWAP, I’ll use it with levels & intraday patterns.
Understanding AVWAP:
The Anchored Volume Weighted Average Price (AVWAP) is a variation of the Volume Weighted Average Price (VWAP) indicator. VWAP calculates the average price of a security based on both volume and price data over a specified period. AVWAP takes this concept a step further by allowing traders to anchor the VWAP to a specific point in time, providing a customized reference point for analysis.
It is calculated by taking the cumulative sum of (Price x Volume) for a specified period of time and dividing it by the cumulative sum of volume over the same period.
Benefits of AVWAP:
1. Accurate market analysis: AVWAP allows traders to analyze the market in relation to a specific event or price level, providing a clearer picture of the prevailing sentiment and potential support or resistance areas.
2. Enhanced trend identification: By anchoring the VWAP to a significant point, such as the market open, previous day's close, or major news event, AVWAP helps identify trends and assess their strength more effectively.
3. Precise entry and exit points: AVWAP provides traders with valuable information about the fair value of an asset based on volume-weighted price data. This knowledge can aid in identifying optimal entry and exit points, improving trade execution.
4. Identifying support and resistance: AVWAP can act as a dynamic support or resistance level. Traders often look for price bounces or breakouts at the AVWAP, especially when volume supports the move.
Below provides an example of how VWAP can be used to provide support/resistance areas. Price bounced right off VWAP + you can see volume increasing at this area of significance.

Now, using the Anchored VWAP or AVWAP on larger time frames, you can use it to note trends like I mentioned above. You anchor the VWAP at significant chances in price action such as highs and lows of the trend you are looking at.
In this example using PENN stock I am anchoring the first VWAP at the highs and am using the weekly time frame (it works on all timeframes but in this case it is easier to use weekly). We can see that price action rejected the AVWAP as it approached it. Safe to say that while price remains below AVWAP, the trend it moving lower.
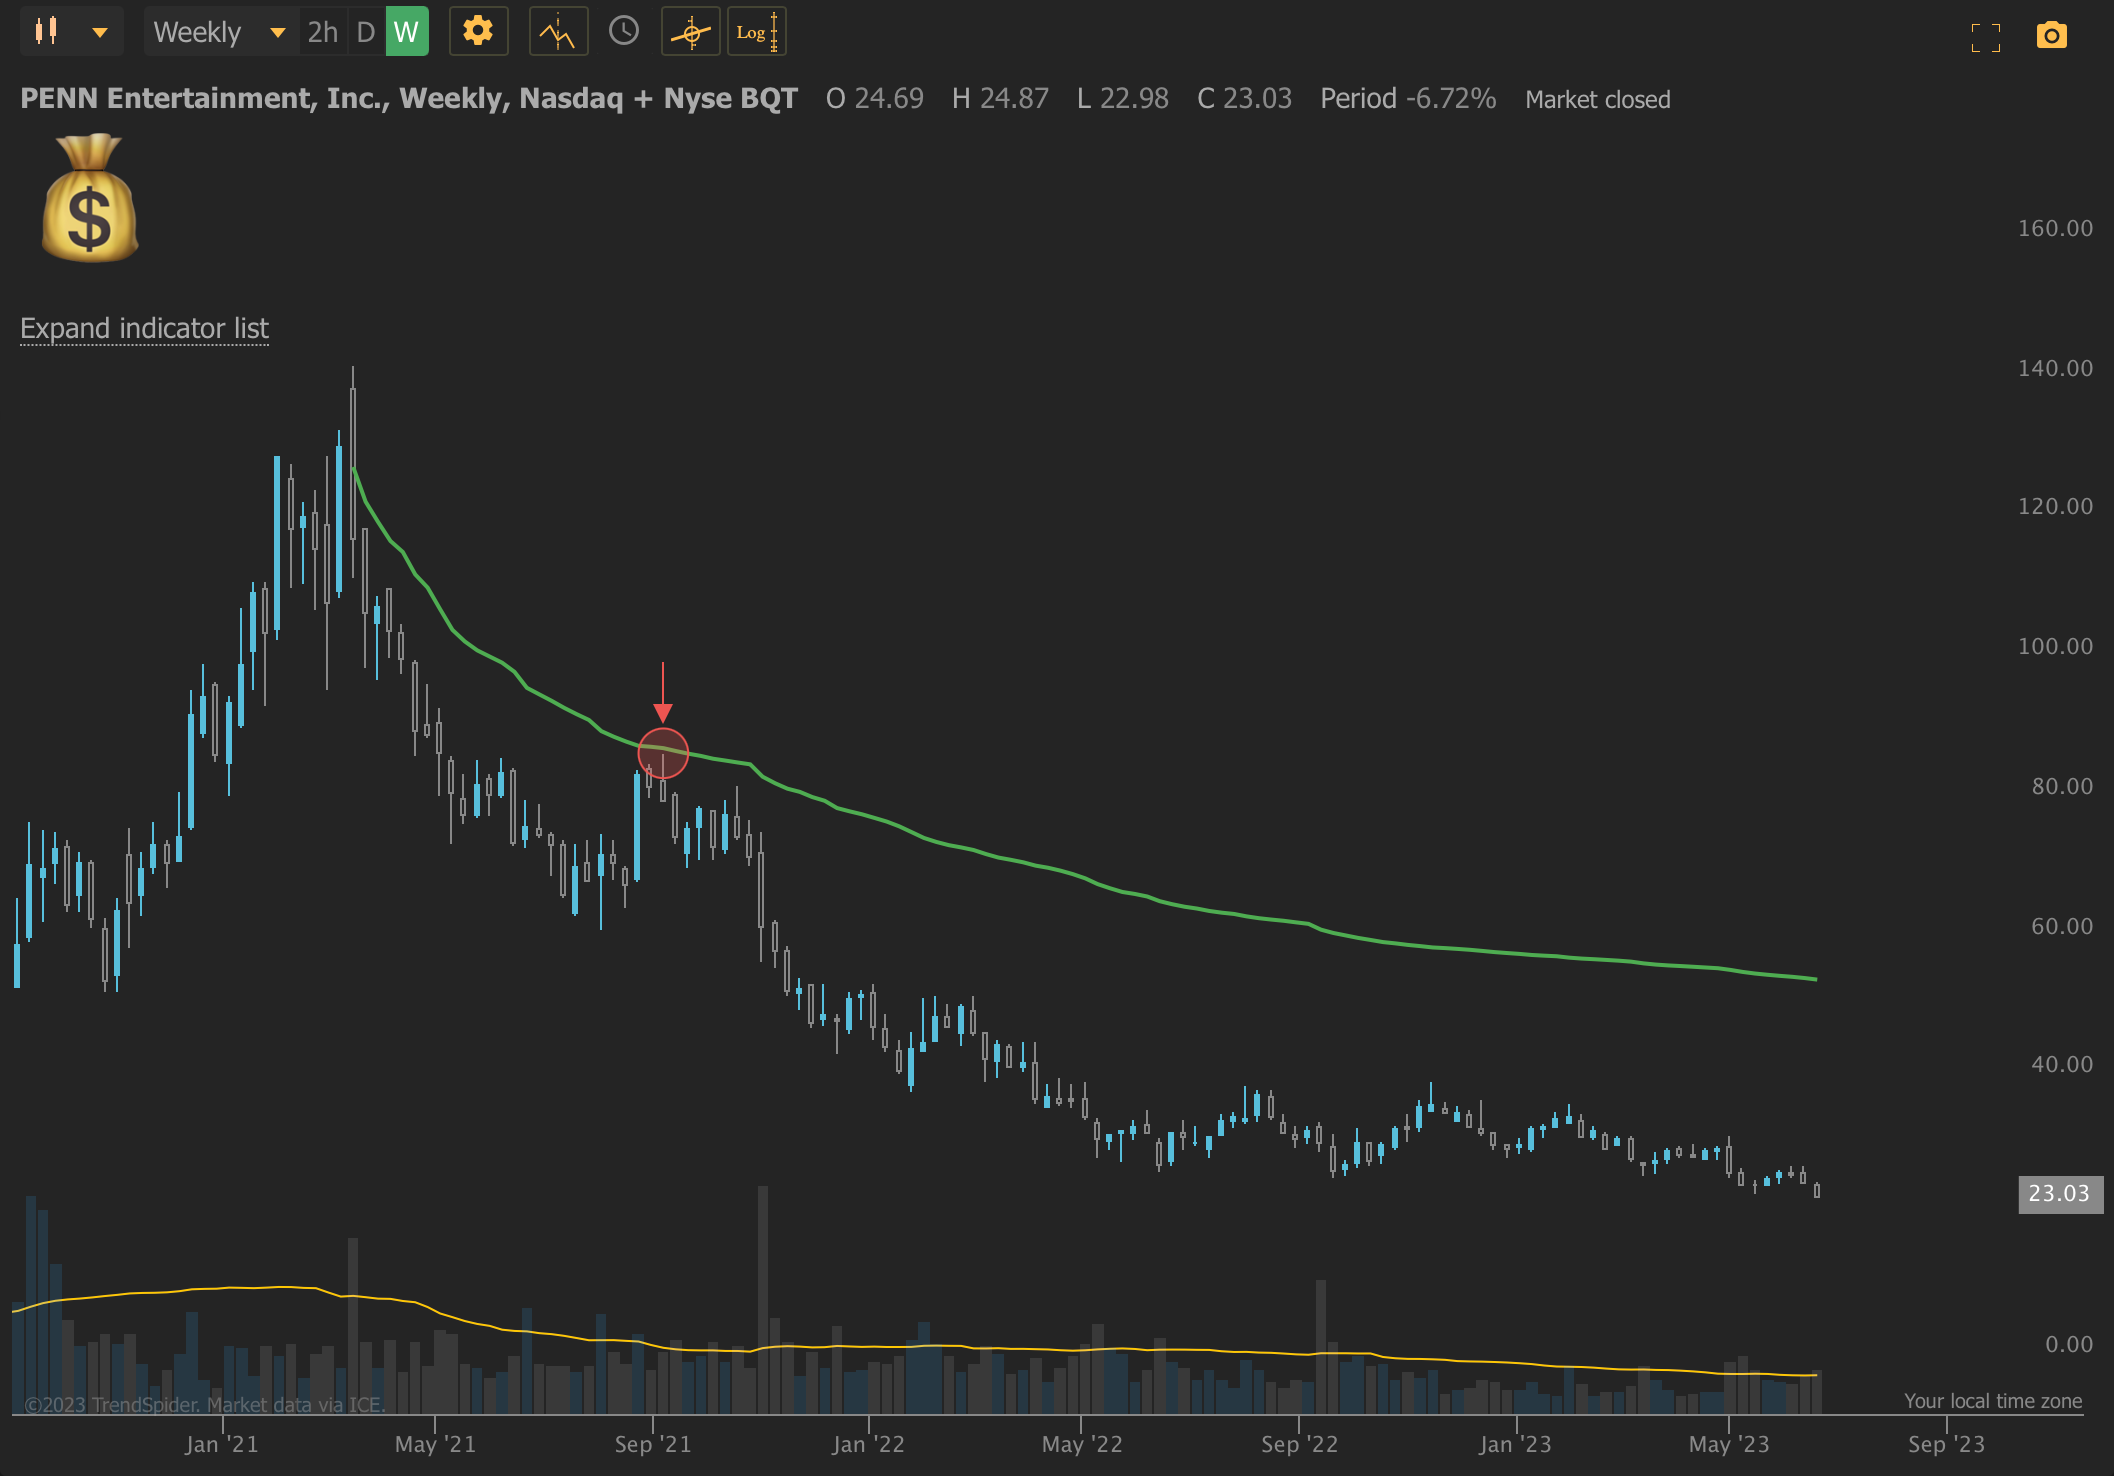
So, we found one significant area and now the swap showing is WAY above price action - How can we continue to find solid R/R setups in this same name (PENN)?? We “handoff” the AVWAP. So now I anchor another AVWAP from where price last touched the VWAP.

We can see that the trend is still lower and where the good R/R setups may be to continue shorting this name. Now let’s AVWAP Handoff a 3rd time! In the chart below you can now see that STILL everything price gets close to the AVWAP we see a rejection.

Like any trading strategy, risk management is crucial when using AVWAP. Set clear stop-loss levels to limit potential losses and adhere to proper position sizing techniques. Additionally, practice using AVWAP on historical charts and in simulated trading environments to gain confidence and refine your skills before implementing it with real capital.
Here is a screenshot of my ThinkorSwim VWAP study I use for intraday trends - I don’t use the upper and lower bands. That’s just my personal preference!

NQ - To see upside bulls need to reclaim $15140. For further downside bears need to take out $14960. Until then, we are rangebound. Upside targets over bull level are $15180, $15235, $15305 - Bear target is $14829.
For ES bulls need to reclaim $4330s and bears want to take out $4280… Break these and I’ll make an update in the subscriber chat :)
Individual Names:
MSFT: This would be a name I’ll keep on watch if the market sees further downside this week. Starting to have that H&S look to it, below $332 I’d be targeting $330 —> $325

CAT: Managed to close back over AVWAP from trend lows. If it can hold over AVWAP $233.50 it can setup for a solid bounce into $240+

CRM: Typical consolidation setup. Needs to get back over $213.50 for a chance at the upper trend + local highs.

NVDA: Potentially setting up for round 2 after a solid run up. As long as it can hold over $416-$417 - Or break Friday’s high - This can maybe setup for $450 target in the coming weeks.
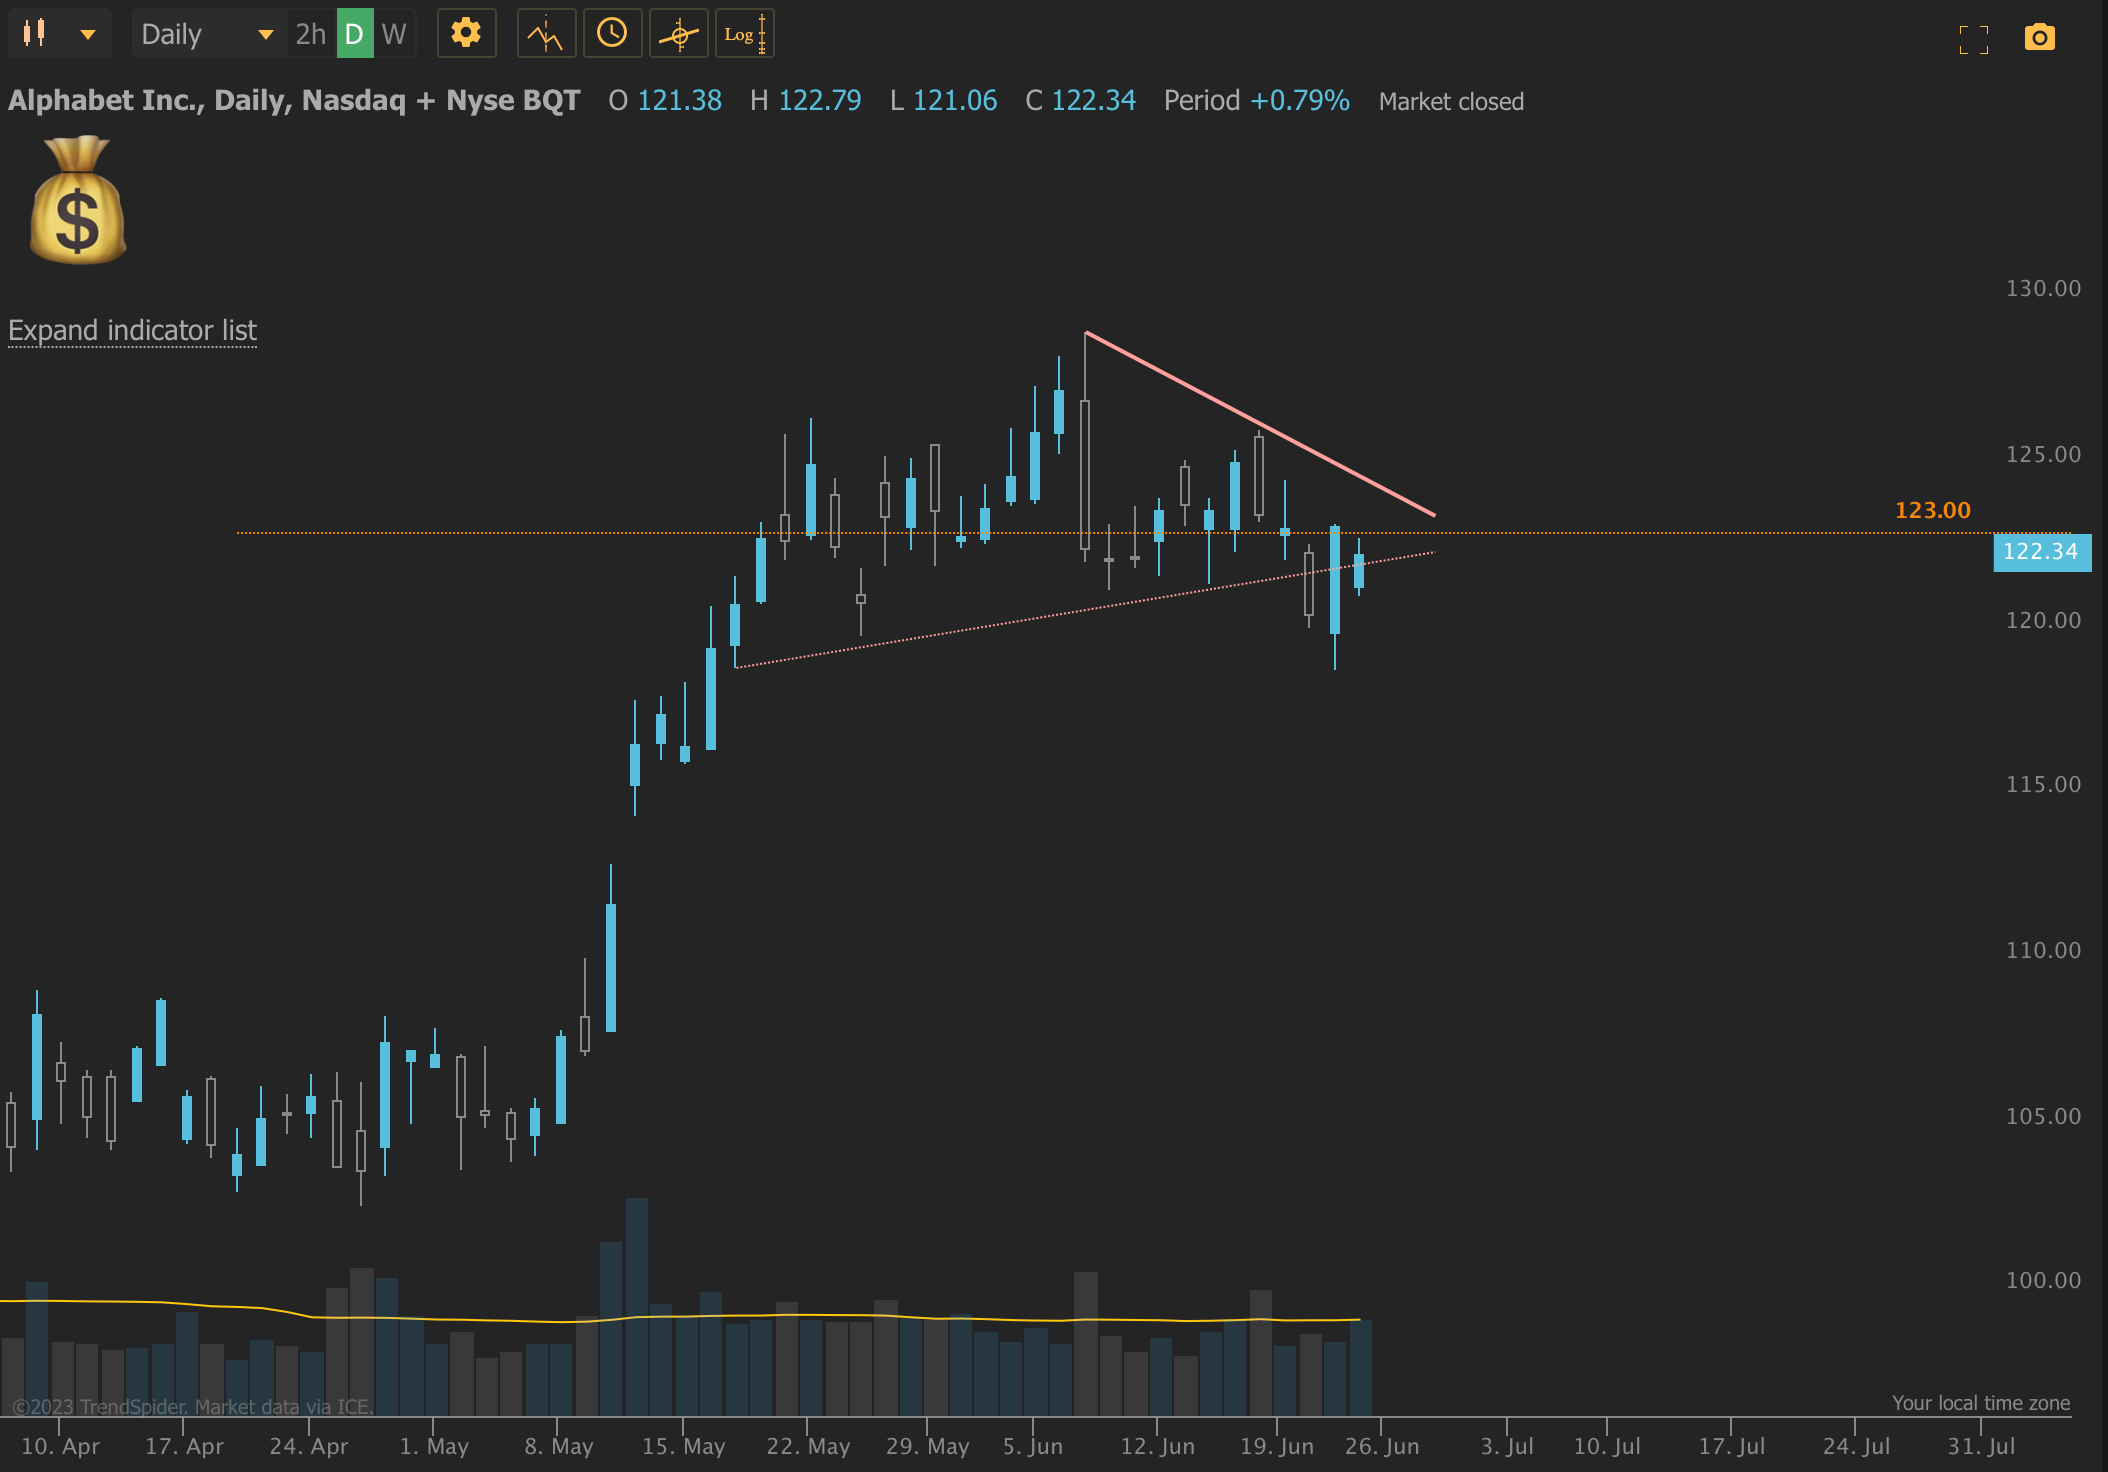
GOOGL: Has been in a sideways action for quite some time now, I’ll be watching to see if it can take out $123 for a chance to see local highs. Place AVWAP from lows and you’ll find it caught support on it last week near lows :)
All charts shared by me are from Trendspider use this link HERE if you’d like to look into their charting software! Occasionally I will share charts from Thinkorswim.
- KR
Disclaimer:
This is my personal analysis and is not to be taken as trading advice. I am not a professional nor am I licensed with anything associated with the Stockmarket. Trading involves risk and you will lose money. Everyone has a different risk tolerance, portfolio size, and style of trading. It is important to trade within your comfort.