
Charting & Trading Guide P.9 → Finding Key Levels For Stocks
Essential For ALL Traders

Part 9 of a free, ongoing series breaking down key indicators, chart patterns, and trading strategies to help everyone better understand the market 🤝
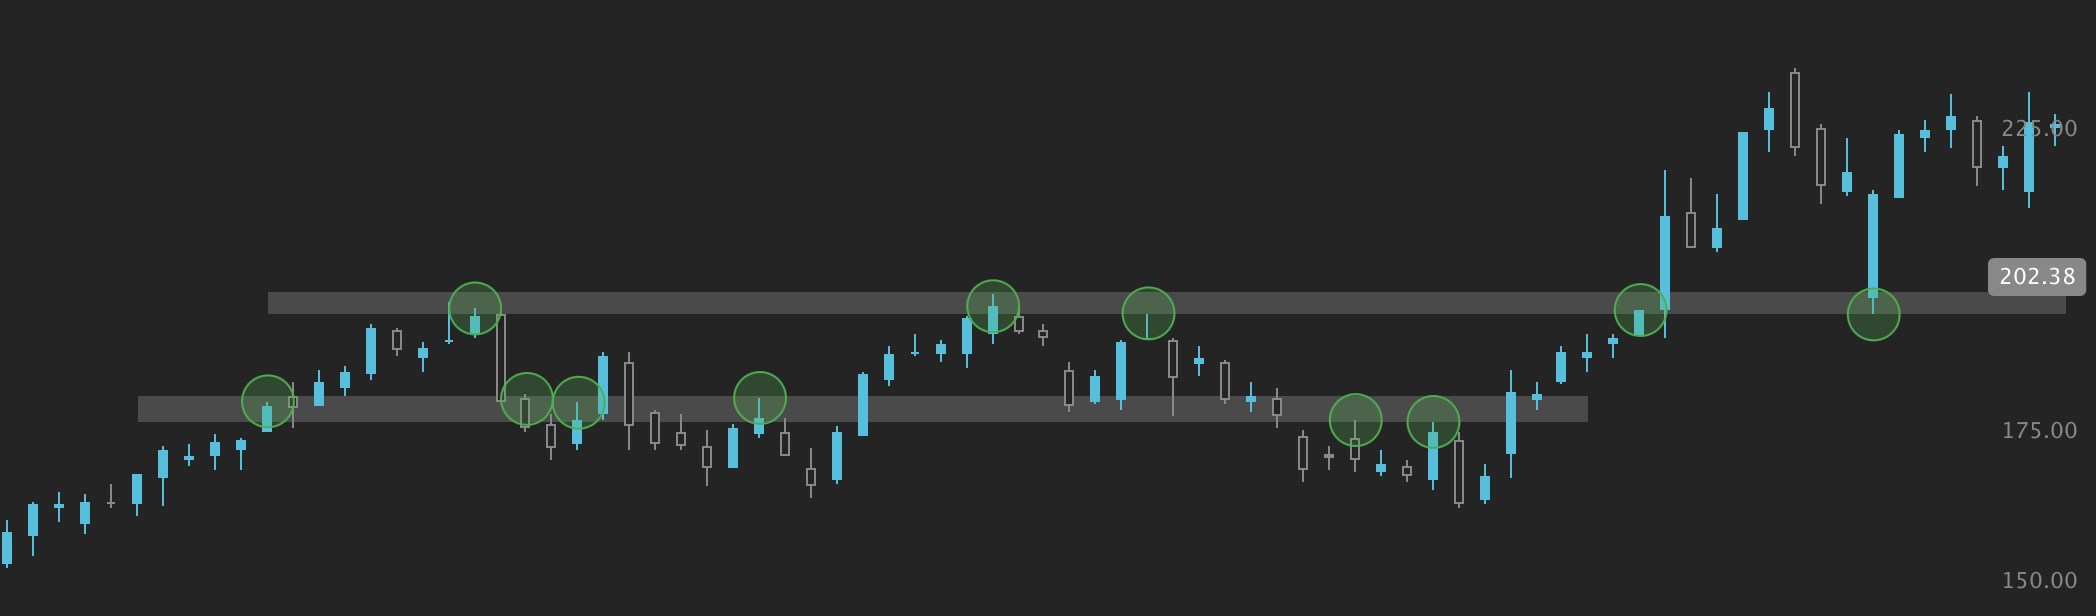
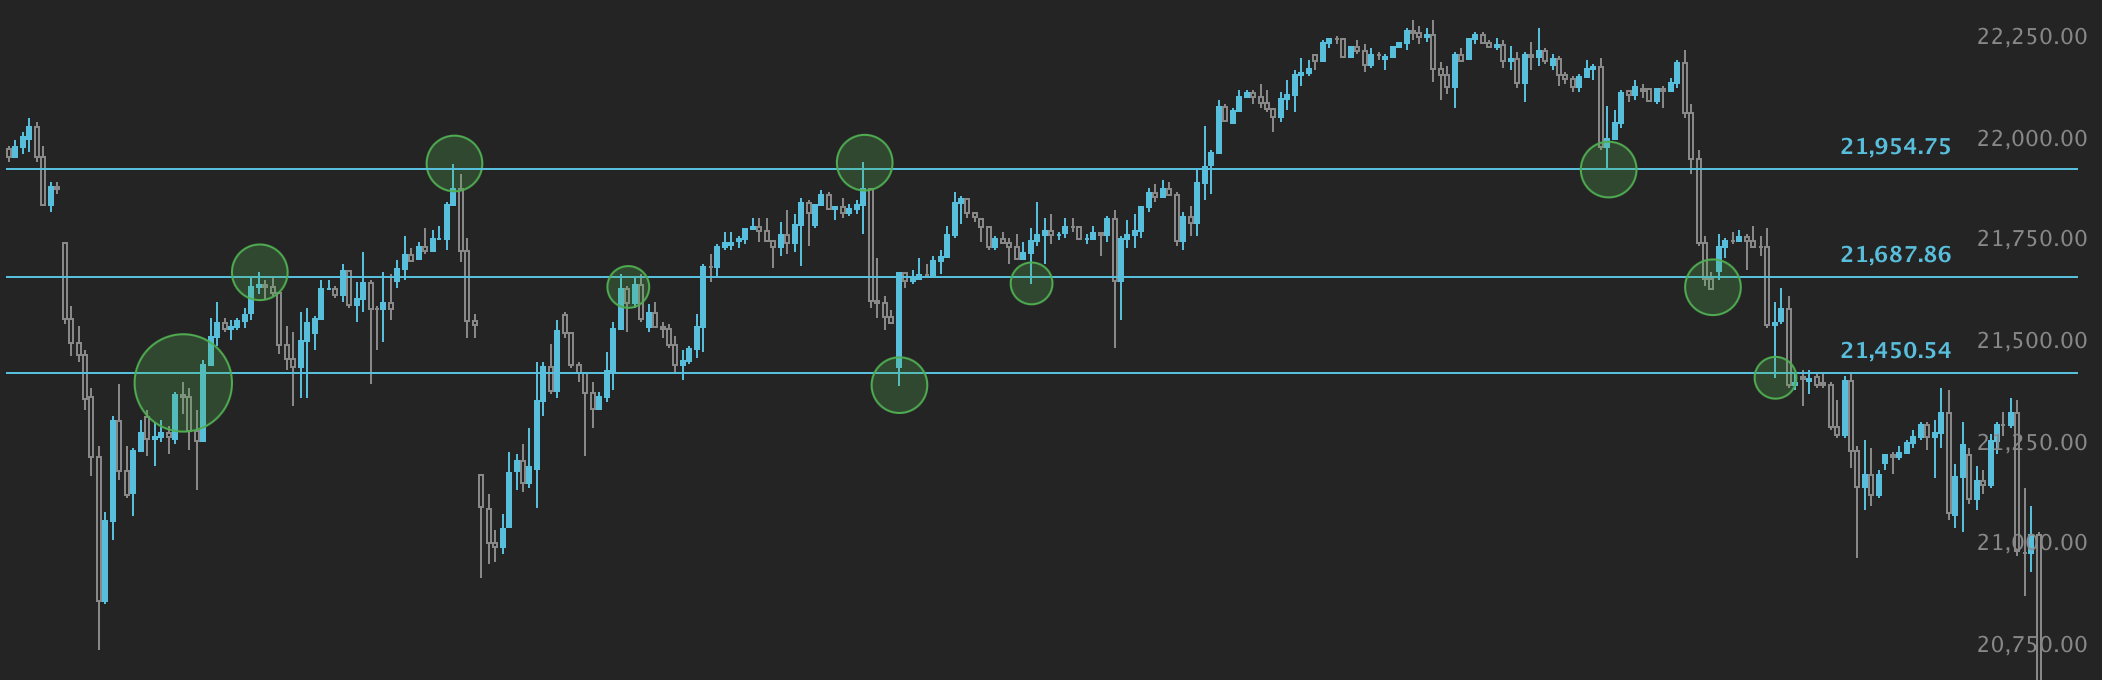
Support and resistance levels are the backbone of technical analysis. They mark where price tends to react - rejecting and reversing (resistance) or bouncing (support).
But the most powerful levels aren’t random lines - they’re backed by confluence from multiple tools.
Here’s how to spot them.
Step 1: Start with the Big Picture
Use higher time frames to identify major zones that have been respected for months or years.
Monthly → Long-term investor levels.
Weekly → Strong swing trade zones.
Daily → Key short-term levels.
Mark levels where:
Price reversed multiple times.
Candle closes cluster.
Previous major highs/lows formed.
Step 2: Refine with Smaller Time Frames
Once you’ve marked major zones, drill down to:
4 Hour
2 Hour
30 Min
These give you:
Micro-support/resistance within the bigger zones.
Cleaner entry and stop-loss placement.
Better timing for breakouts or bounces.
Step 3: Add Confluence for Stronger Levels
The more evidence you have that a level matters, the higher the probability it works.
Here are confluence factors to look for:
AVWAP (Anchored VWAP)
Anchor it to key events like earnings, major highs/lows, or large volume days.
If AVWAP aligns with your marked level, that zone has institutional interest.
Volume Shelves (from Volume Profile)
Look for High Volume Nodes (HVN) → areas of heavy trading activity that act as magnets/support.
Look for Low Volume Nodes (LVN) → thin areas where price often moves quickly.
Psychological Levels
Round numbers (e.g., $100, $500, $1000) often become natural support/resistance.
Trendlines / Channels
If a horizontal level also lines up with a trendline, the confluence is even stronger.
Moving Averages
Popular ones: 20 EMA, 50 SMA, 200 SMA.
Institutions often respect these as dynamic support/resistance.
Step 4: Confirm with Price Action
Before trading a level:
Look for multiple rejections/wicks at the same zone.
Watch for false breakouts (liquidity grabs).
Wait for volume confirmation before entering.
Tips:
Levels on larger time frames + AVWAP + volume shelf = high probability trade zone. The more tools that agree, the better your odds.
Following these levels in the direction of price makes it less of a headache and easier to ride the trend longer!
- KR
Reminder: This is not financial advice. These are my trade ideas and you should do your own research before taking any trades. I provide the daily trade ideas I am watching. It is up to you to read them and form your plan on how you want to trade them.Disclaimer:
This is my personal analysis and is not to be taken as trading advice. I am not a professional nor am I licensed with anything associated with the Stockmarket. Trading involves risk and you WILL LOSE MONEY. Everyone has a different risk tolerance, portfolio size, and style of trading. It is important to trade within your comfort.